If you’ve read a study about arts participation in the United States in the past few years, it’s a fair bet that it was authored, co-authored, or influenced by Jennifer Novak-Leonard. The University of Chicago researcher has maintained a breathtaking pace of output recently, nearly all of it focused on better understanding the ways in which people engage in and feel about arts and culture, broadly defined. The first five months of 2015 alone have seen the publication of no fewer than five texts listing Novak-Leonard as the lead author, picking apart arts participation statistics in every way imaginable over the course of some 250+ not exactly beach-reading pages.
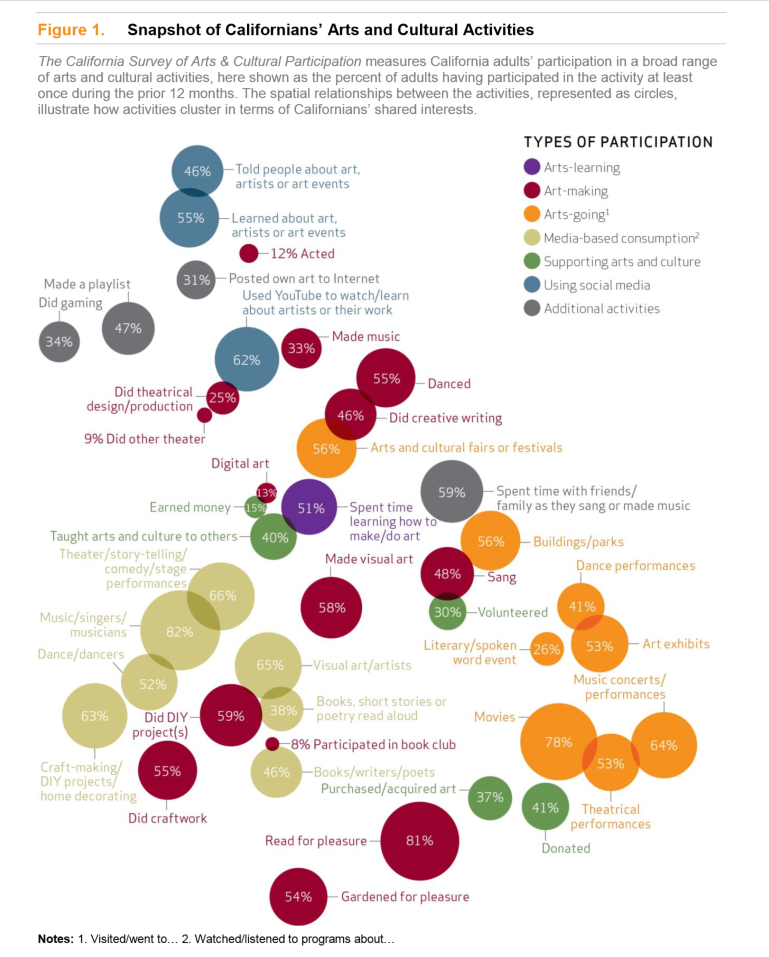
The James Irvine Foundation, which has been a critical enabler of this work for nearly a decade, came out this spring with a cluster of arts participation studies by Novak-Leonard and others. Chief among these is “The Cultural Lives of Californians,” which synthesizes lessons from a new telephone survey of 1238 Golden State residents specially designed by Novak-Leonard and her colleagues at NORC at the University of Chicago. This so-called California Survey is an attempt to model a different approach to measuring cultural participation by offering a broader take on what “counts” as arts and culture than the statistics we typically hear about. Rather than limit the inquiry to questions about specific types of participation, the survey begins with an open-ended prompt about what role arts and culture plays in the respondent’s life:
People are involved indifferent types of activities that they enjoy or that are important to them. Please briefly tell me about any creative, cultural or artistic activities that you do.
If stumped, respondents were encouraged think broadly, with suggestions like “You could include anything you do that involves making music, dancing, roleplaying or telling stories, writing or making art. Also think of activities when you make something, or build, customize or repurpose something to your liking.” The resulting range of activities recorded is highly illuminating, and includes such seemingly off-the-wall responses as sandblasting mirrors, customizing old cars, and my favorite, making bowties that incorporate people’s personality characteristics. Clearly, Americans (or at least Californians) define cultural participation very broadly indeed. Importantly, about 15% of the responses had no correspondence with later closed-ended questions in the survey that asked about a range of specific types of participation, meaning that surveys that rely solely on closed-ended questions, such as the NEA’s Survey of Public Participation in the Arts, likely miss a substantial portion of the cultural activity that goes on. Yet even with this open-ended (and, let’s face it, highly leading) approach, a little over 6% of respondents to the California Survey either only mentioned sports-related activities or couldn’t come up with a single way in which they engage culturally, which probably sets a pretty hard upper bound on the percentage of the population that is culturally active for reasons elaborated on below.
 While the bulk of “The Cultural Lives of Californians” is devoted to findings that are familiar from previous participation literature, a few new perspectives are offered. In particular, the report brings valuable attention to a consistent pattern of lower participation among immigrants, even those of the same ethnic background as non-immigrants. The authors explain that immigrants work more hours and have less leisure time than the rest of the population, which could account for the difference. “Cultural Lives” also documents a significant pattern of decreased art-making (as distinct from arts attendance) as people age, which overshadows the effect of income and education on that particular form of participation.
More than anything, the report repeatedly emphasizes the wide range of ways in which Californians engage with culture, and makes an argument for funders, researchers, and arts practitioners to use a wider aperture in conceptualizing participation. In particular, art-making activities that take place inside the home or outside of traditional arts spaces receive much attention from the authors, and the survey provides data on the demographic breakdowns of participants in such activities at a greater level of detail than we’ve seen in any other study.
Informal Yet Not (Fully) Inclusive
It turns out that “The Cultural Lives of Californians” is very timely for Createquity’s research process for that reason. A big question running through our investigation into socioeconomic status and arts participation earlier this year was whether poor and less-educated adults are less likely to participate in the arts generally, or just have different patterns of participation that don’t show up as readily in surveys and market research that focus on traditional nonprofit institutions. It’s long been an article of faith in the community arts field that the latter of these two assumptions is true; in other words, that the people who are not coming to the symphony or the ballet are instead experiencing music, dance, and other art forms in their homes, places of worship, and other “informal” contexts.
Despite its explicit goal of uncovering the hidden ways in which Californians participate in culture, there is not a lot of evidence in “Cultural Lives” to suggest that poor and less-educated adults are more likely than others to engage in the informal arts. For example, 60% of respondents with less than a high school diploma spent time with friends or family making music, compared to 73% with an advanced degree; there is a similar slightly upward trend by income associated with that activity. While we don’t see the kinds of dramatic differences across education and especially income as we do with various forms of physical attendance – the ones noted above are within the margin of error for the survey – there is no category of participation that demonstrates a clear pattern in the opposite direction, of higher participation by adults in the bottom income quartile or who never attended college. Put another way, while poor and economically disadvantaged adults may be more likely to sing to themselves or dance with friends than see the opera, the same is true of people with college degrees and well-paying jobs.
Survey Says…Don’t Trust (Most) Surveys?
Discussion about “The Cultural Lives of Californians” will no doubt focus primarily on its content and findings, but the study is no less notable for what it has to teach us about survey methodology and the art of measurement.
The project of which “Cultural Lives” is a part represents an ambitious and serious bid to move the practice of measuring cultural participation forward. In addition to the survey and accompanying analysis, the Irvine Foundation has also published a technical appendix that is longer than the report itself; a review of theoretical constructs and issues in arts participation research; and an entirely separate analysis of the California-based respondents to the NEA’s Survey of Public Participation in the Arts (SPPA). This last bit is especially important because it provides for direct comparisons between the “old” and “new” ways of measuring participation – the researchers even used the exact same question wording across surveys in many cases in order to facilitate such comparisons.
As a result, and because of the tremendous level of transparency provided by the authors, we can learn a lot about the effects that survey design and administration have on cultural participation data. Fortunately for the sake of making this article interesting, but unfortunately from the perspective of researchers and practitioners, it turns out that conclusions can differ substantially depending on the choices made in constructing the survey.
In her forward to “Cultural Lives,” Irvine Foundation arts program director Josephine Ramirez declares, “the new narrative is not about decline! Californians actually have a deep interest in the arts and lead active cultural lives.” While the report can’t comment one way or another on decline since there is no longitudinal component to the data, what I take Ramirez to mean here is that when you broaden the definition of what’s included in arts and culture, all of the sudden you see a lot more people participating than you did before. That is true, but it turns out that much of that apparent increase is attributable to the survey itself.
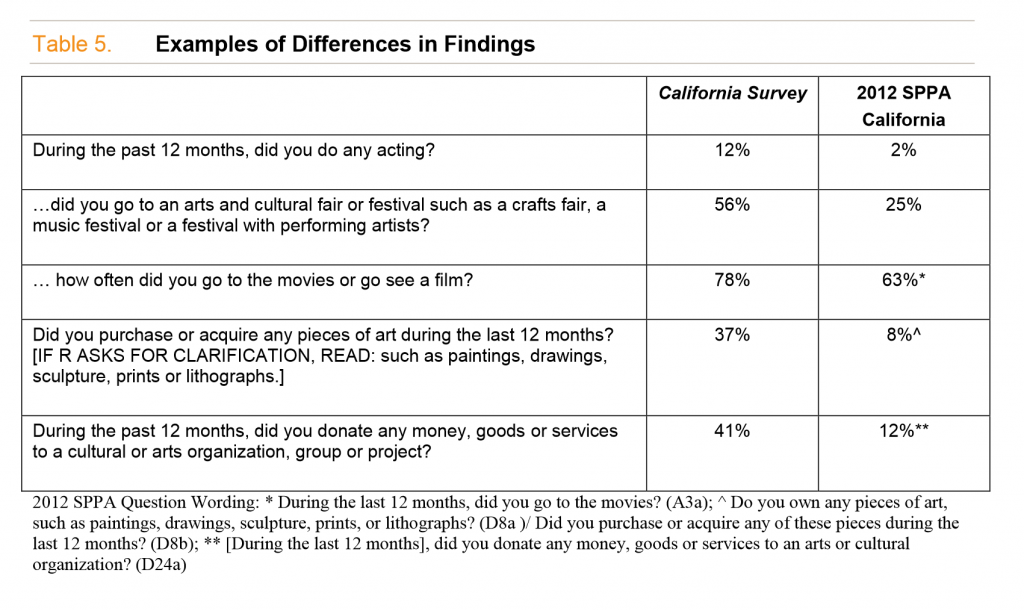
The values observed in the respondent set to “Cultural Lives of Californians” are consistently higher than seen in comparable questions in the SPPA and other data sources, sometimes dramatically so. For example, the California Survey reports a prevalence of acting six times higher than California respondents to the SPPA; four times higher for purchasing or acquiring art; and double the rate of attending a cultural fair or festival. These are not deceptively small adjustments within the margin of error; some of the differences here approach or exceed 30 percentage points. To their credit, the authors noticed this pattern and even made a table to summarize some of the most eye-popping differences in the technical appendix:
By way of explanation, Novak-Leonard et al. cite the broader frame of the California Survey as a whole (although this doesn’t explain the difference in directly comparable questions), and credit the open-ended question about participation at the beginning of the survey and example prompts throughout for jogging respondents’ memories. Most notably, they cast doubt on the methodology of the SPPA, implying that the abrupt transition to the set of questions about arts and culture as well as the switch in recall period from the past week to the past year are confusing for participants and result in false negatives.
These explanations are quite plausible and (with the exception of the broader frame, as discussed above) very likely account for at least some of the gap between survey results. However, the authors seem to go out of their way not to consider another possibility, which is that the California Survey may suffer from increased nonresponse bias. The response rate to the survey is substantially lower* than that of the Survey of Public Participation in the Arts, which opens up a higher risk for bias in light of the targeted nature of the survey. The SPPA is an attachment to a larger, multi-modal measurement exercise called the Current Population Survey that is administered by the Census Bureau; thus, respondents to the CPS agree to participate in the survey without knowing that they’re going to be asked questions about their arts engagement habits. By contrast, the California Survey is a telephone-only survey that was upfront about being interested in people’s cultural lives, with the result that people who have richer cultural lives may have been more likely to respond. This is seen perhaps most clearly in the discussion of volunteering for an arts organization, as follows:
Forty-one percent of California adults donated money, goods or services to an arts or cultural organization or project and almost one-third (30 percent) otherwise volunteered to help an arts or cultural organization….These rates of support are substantially higher than those generally seen in other studies that ask about support for arts and culture….In addition, a report released by the United States Census Bureau in early 2014 finds that approximately 26 percent of U.S. adults aged 25 and older volunteered in any way…
In other words, the California Survey found that adults in California volunteer for arts organizations at a higher rate than adults nationally volunteer for anything!
This is not the first time that we’ve seen this phenomenon in evidence with participation data. In 2008, Irvine published the results of a survey by Novak-Leonard (then known as Jennifer Novak) and Alan Brown that purported to measure cultural engagement patterns among Californians living in the state’s inland regions. Createquity’s analysis of that report noted the following:
While most of WolfBrown’s measures cannot be compared with those in the SPPA, many that do show significantly higher levels of activity. For instance, 30% of Cultural Engagement respondents said they “regularly” attend stage plays; only 12.5% of SPPA respondents in the Pacific region claim to have done so even once in the past year. Six percent of Cultural Engagement respondents perform dances, but just 2.1% of Pacific region SPPA respondents do.
Now, with even more direct comparisons possible with the SPPA, we see such differences persisting or even expanding. Is the variance the result, as the authors suggest, of the SPPA not giving people enough to go on as they try to think of ways in which they’ve participated in the arts? Or is the culprit nonresponse bias, meaning that the California Survey’s numbers are inflated? My guess would be that it’s some of both, and that “true” participation rates are somewhere in between these estimates. Seemingly mundane details like where a question appears in a survey have indeed been shown to have surprisingly large impacts on results in some cases. However, in its 2012 review of the threat of nonresponse bias to public opinion surveys, the Pew Research Center observed, “survey participants tend to be significantly more engaged in civic activity than those who do not participate, confirming what previous research has shown…This has serious implications for a survey’s ability to accurately gauge behaviors related to volunteerism and civic activity. For example, telephone surveys may overestimate such behaviors as church attendance, contacting elected officials, or attending campaign events.”
Regardless of the explanation, the fact that two different surveys asking the exact same questions of the exact same target population could come up with such disparate results has important implications for anyone who uses survey research in their work. Ultimately, the lesson here is that survey results are much more sensitive to both design and administration choices than we would like to think. And with response rates for surveys getting worse and worse, there seems to be a strong suggestion that even with a random sample and a professional approach, a survey that signals too strongly the subject under study can bias results if part of what’s being measured is interest in that subject. That should be a heads up for every arts organization that surveys its own audience members, an extremely common practice throughout the industry. If your market research relies on people taking the time to tell you whether they’re interested in what you have to offer, odds are you’ll be hearing from the most interested people.
Fortunately, all hope is not lost for cultural participation research. As if publishing five reports in five months wasn’t enough, Novak-Leonard has been working closely with the NEA for several years now to address some of the deficiencies in the SPPA and introduce more inclusive questions. A marriage of the more thoughtful survey design elements from the California Survey with the increased resources for ensuring a representative data set that the federal government can provide would result in the best cultural participation data we’ve yet seen. Let’s just hope that those government statistics-gathering efforts can survive political pressure and budget cuts long enough for that vision can come to pass.
* NORC researchers actually calculated two versions of the weighted response rate, each of which used different assumptions for estimating what percentage of telephone numbers that didn’t result in a completed survey were eligible to be included in the first place. The higher of these response rates, 31.6%, is the one shared in the report’s technical appendix. Following a lengthy email exchange with two individuals at NORC who worked on the survey, my sense is that the lower number, 9.9%, is likely a better estimate. I am happy to share the details of the exchange with anyone who is interested. By comparison, the response rate to the Current Population Survey, of which the SPPA is a part, is 75%.

